
How to use satellite observations to build a 1D hydraulic model, part 2 : data and preprocessing
As presented in part 1, the definition of the geometry of a 1D hydraulic model is twofold: a) the river network planform (on a map) and b) the geometry of the cross-sections.
- River network
In our methodology, the definition of the river network (planform) and the location of the cross-sections are predefined using the SWOT a priori River Database (SWORD, Altenau et al, 2020), which contains the river network segmented in connected reaches (river portions of a few kilometers) and each reach is composed of river nodes approximately distant of 250m. The cross-sections of our hydraulic model are located at each SWORD node and the river network is computed from the connectivity of the SWORD reaches.
- Cross-section geometry
For each cross-section, the geometry in the (t,z) plane (see Figure 1) are represented as tuples of (Z,W) where Z is a water surface elevation (wse) and W the top width. These tuples of (Z,W)i=0,N are estimated by merging two different sourcces of data: (ii) altimetric data for H and watermasks to estimate top width W.
For the altimetric data, our methodology can leverage any of the altimetry mission (for instance EnviSat, the Jason missions, Sentinel-3 SRAL, IceSat-2, SWOT).
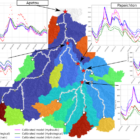
Watermasks are usually computed either from optical images (Sentinel 2, Landsat missions, Pleiades.) or radar images (Sentinel 1, RadarSat, etc.). To avoid the cloud‑related issues that can occur with optical imagery, Sentinel‑1 SAR data were here favoured. Over the Garonne River Basin, 4 paths were used, and around 240 products were processed for 2024 (about 30 dates per path). Both ascending and descending orbits were used to build these water masks, as illustrated in Figure 2. This processing was carried out using ICUBE-SERTIT’s ExtractEO (Maxant et al. 2022) chain, applied to the full dataset.
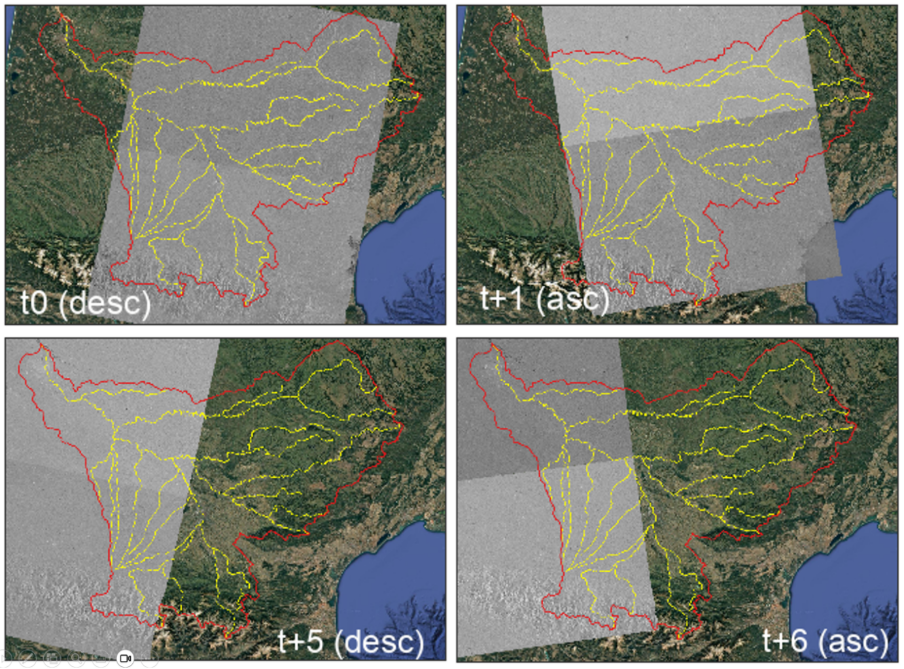
Figure 2 : The Garonne River Basin (red contour) and main river reaches (yellow lines), and four S1 paths obtained on a given data (6-day window) both from ascending and descending orbits
A first filtering step was then performed to exclude smaller rivers based on their width. Given the 20 m resolution of the images, some rivers could not be accurately detected and were therefore removed.
It was also observed that a significant portion of the water mask was not detected due to vegetation shadowing (see Figure 3). Combining ascending and descending paths, separated by one-day intervals, we finally obtained 60 complete masks for 2024, which are being used for river network hydraulic model set-up.
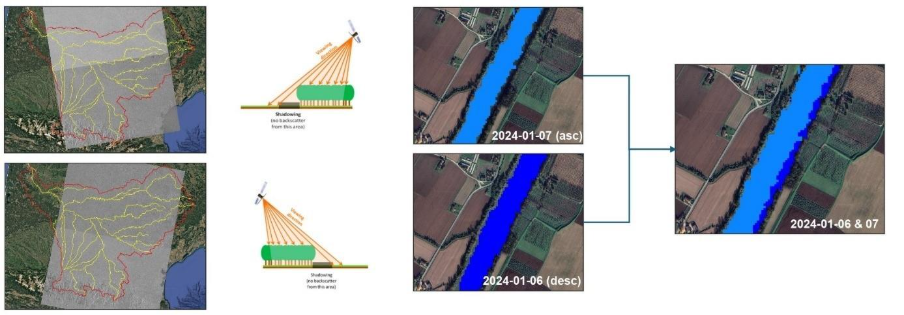
Figure 3 : Impact on vegetation shadowing on single path depending on descending or ascending course (central figures) and improvement achieved by using both jointly ascending and descending tracks (right panel).
Note that the methodology is generic and can be further re-employed for other river network models and other basins, and that the shadowing will depend on vegetation height and river geometry.
Next part (Part 3) will conclude this series of news with the presentation of the core components of the method and the application to the Garonne River basin.
References
Altenau, E. H., Pavelsky, T. M., Durand, M. T., Yang, X., Frasson, R. P. d. M., & Bendezu, L. (2021). The surface water and ocean topography (SWOT) mission river database (SWORD): A global river network for satellite data products. Water Resources Research, 57, e2021WR030054. https://doi.org/10.1029/2021WR030054
Maxant, J.; Braun, R.; Caspard, M.; Clandillon, S. ExtractEO, a Pipeline for Disaster Extent Mapping in the Context of Emergency Management. Remote Sens. 2022, 14, 5253. https://doi.org/10.3390/rs14205253
How to use satellite observations to build a 1D hydraulic model, part 1 : context and objectives - Hydravatar
[…] series, the application of this methodology will be presented on the Garonne River basin in France. Part 2 will introduce the EO data of interest and how to preprocess them and part 3 will present the core […]